Every few years, the government asks a real sample of India’s farming families about their income, debt, and land. The NSSO’s Situation Assessment Survey of Agricultural Households (SAS) is that survey, and it is the single most-cited data source UPSC uses to test farm-economy facts.

 MCQ Questions
🌾 Must Know
1. What the Survey Is
- Origin The Situation Assessment Survey (SAS) is conducted by the National Statistical Office (NSO), under the Ministry of Statistics and Programme Implementation (MoSPI). It studies the economic condition of India’s farming households.
- 70th Round The most-cited SAS round ran as NSSO’s 70th Round, from January to December 2013. Its reference period was the agricultural year July 2012 to June 2013.
- Definition An agricultural household was defined as one earning more than ₹3,000 in value of produce from agricultural activity in the past year. It also needed at least one member self-employed in agriculture, in principal or subsidiary status, during the preceding 365 days.
2. Rajasthan’s Highest Share
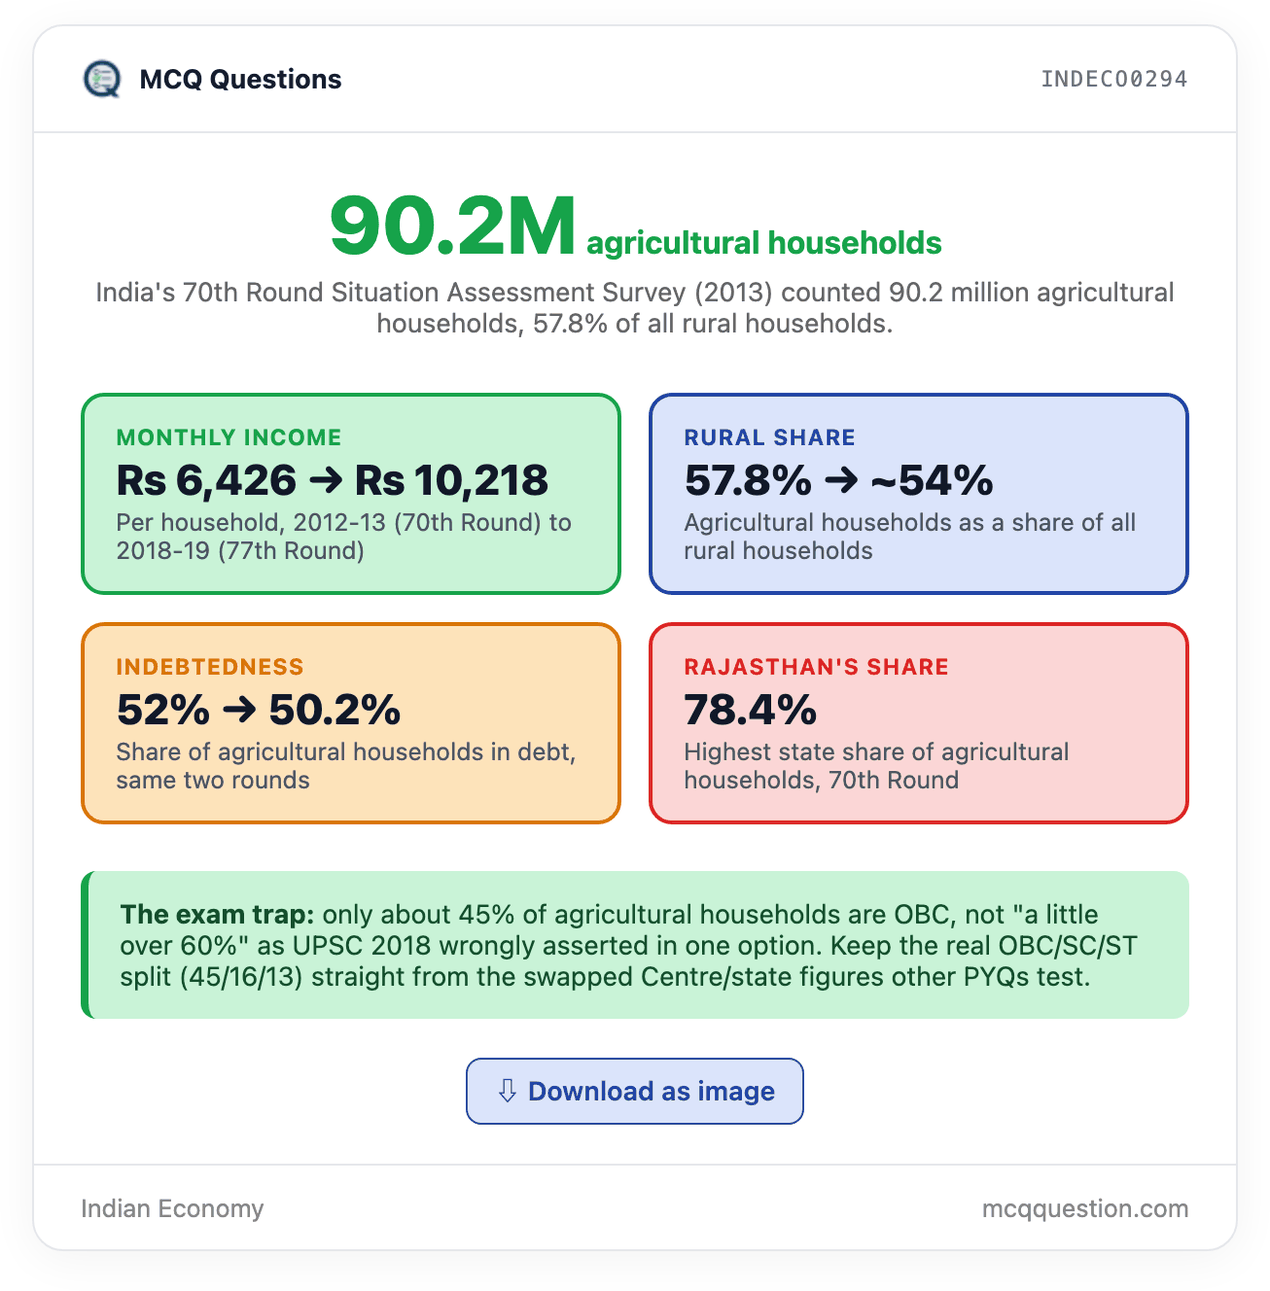
- State ranking Rajasthan had the highest share of agricultural households among its own rural households, at 78.4%. Uttar Pradesh followed at 74.8%, and Madhya Pradesh at 70.8%.
3. Social-Group Breakdown
- OBC share About 45% of India’s agricultural households belonged to Other Backward Classes (OBC), not “a little over 60%” as one UPSC option wrongly claimed. Scheduled Castes made up about 16%, and Scheduled Tribes about 13%.
4. Kerala’s Non-Farm Income
- Outlier state In Kerala, about 61% of agricultural households earned their maximum income from sources other than farming. Kerala was the only major state where non-farm income outweighed farm income for most agricultural households.
📊 Good to Know
1. National Scale
- Total count The 70th Round estimated 90.2 million agricultural households in rural India. That was about 57.8% of all rural households in the country.
2. Income and Debt in 2012-13
- Monthly income Average monthly income per agricultural household was ₹6,426 in 2012-13. About 52% of agricultural households were in debt at that time.
3. What the Survey Covers
- Scope SAS collects data on farm income, farm and non-farm expenditure, indebtedness, and household assets. It also asks about access to farm inputs, technology, and government schemes.
4. Rural-Only Coverage
- Sampling SAS is a rural-only survey. It does not sample urban households, since its purpose is specifically to assess the farming population.
5. Companion Survey
- AIDIS link SAS is often run alongside the All India Debt and Investment Survey (AIDIS), which covers both rural and urban household debt and assets more broadly, not farm households alone.
Test Yourself


🔍 Great to Know
1. The 77th Round Update
- Integration The follow-up round, NSS 77th Round (January-December 2019), merged SAS with the separate Land and Livestock Holdings Survey. One combined questionnaire was canvassed on the same sample of households, instead of two separate surveys.
2. A Higher Income Threshold
- Definition update The 77th Round raised the agricultural-household income threshold to ₹4,000 of annual produce value, up from the 70th Round’s ₹3,000. The self-employment condition stayed the same.
3. Income and Debt Six Years Later
- 2018-19 figures Average monthly income per agricultural household rose to ₹10,218 in 2018-19, up from ₹6,426 in 2012-13. Indebtedness edged down slightly, from 52% to 50.2% of agricultural households.
- Loan size The average outstanding loan among indebted households rose sharply, from ₹47,000 to ₹74,121, even as the debt-holding share fell. Households in debt were borrowing much larger amounts.
4. A Shrinking Farm-Household Share
- Rural shift The share of agricultural households among all rural households fell from 57.8% in 2013 to about 54% in 2019. This reflects continuing rural diversification into non-farm work.
📰 Current Affairs
The Next SAS Round Is Already Scheduled
- 2026-27 round As of September 2025, MoSPI announced that the NSO will run both AIDIS and the next SAS round from July 2026 to June 2027. This new round will update farm income, debt, and asset data for the first time since the 77th Round. (Source: PIB)
- Draft schedules public MoSPI placed draft concept notes and survey schedules for both surveys on its own website for public and stakeholder feedback, ahead of the field survey starting. (Source: PIB)
📝 Previous Year Question
UPSC CSP 2018 — Rajasthan, OBCs, and Kerala’s Non-Farm Income
- UPSC 2018 The correct answer is (c) 1 and 3 only. Statement 1 is correct: Rajasthan does have the highest share of agricultural households among its rural households, at 78.4%.
- UPSC 2018 Statement 2 is wrong. Only about 45% of agricultural households are OBC, not “a little over 60%.” Statement 3 is correct: about 61% of Kerala’s agricultural households earned most of their income from non-farm sources. See UPSC CSP 2018 GS Paper I, Q3.
Leave a Reply